Detail S-1380 READ8 Software
READ8 is a general purpose, Windows-based program for Hamar Laser alignment equipment. When a target ( or targets) is connected to a Hamar Laser A-908, R-355D or R-358 interface and personal computer, the program acts as a target readout and provides the ability to plot numerical readings from the target and display them graphically, develop offsets and record data in several different methods. Read8 can be run in manual data mode, allowing the program to run without being hooked up to the alignment hardware. This simulation allows the user to become familiar with the software before performing an actual alignment.
Plot Data
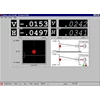
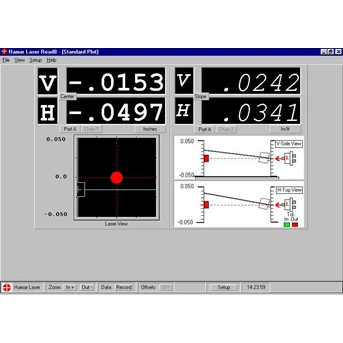
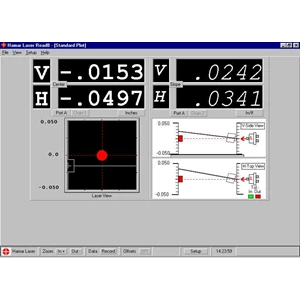
Both the numeric and graphical data displays show center and slope target positions relative to the laser beam. The displays move with each adjustment, allowing easy correction for misalignment. Depending on the target selection, Read8 can display data in four different ways:
• Standard Plot - displays either two center readings for two different targets or center and slope readings for a single 4-axis target.
• Combined Plot - displays a perspective view of center and slope readings for a single 4-axis target.
• Spindle Plot - displays graphical views of spindle misalignment.
• Scan Plot - displays the vertical position for up to four targets
Calculate Offsets
The Offset Utility provides eight different ways to develop corrections for misalignment or mounting errors of the target and laser and are usually used for spindle-type alignments, such as lathes. Step-by-step prompts and setup graphics are provided, as well as the ability to toggle offsets on and off. Available Offsets include Zero, Buck-in, Spindle, Manual Offset, Align Target, Align Laser, Virtual Center in Front, and Virtual Center Behind, depending on the target in use. All offset screens contain graphical representations for laser and target setup and either step-by-step prompts for information or interactive wizards to aid in setting up offsets.
Record Data
Provides a general-purpose data-taking utility, a utility to check the repeatability of readings, and a utility to monitor variations in readings over time. Target information may be recorded in three different ways. All recorded data can be saved, reviewed, printed, edited and exported to a Microsoft Excel spreadsheet.
Options
1. Air Noise - general purpose data logging utility that repeatedly takes samples and averages out effects of air turbulence on a reading.
2. Repeat Mode - tests for the repeatability of results obtained with a specific fixture or hardware setup.
3. S Timer - highly flexible recording mode that records data at regular intervals for a fixed period of time to determine changes, such as thermal growth monitoring.
4. Quick Plot - a fast recording mode that collects and plots straight-line alignment information. Data is plotted on a graph as it is taken. Designed to plot vertical ( side view) and horizontal ( top view) centers and is used for straight-line measurement, such as plotting the flatness and straightness of a way, measuring the vertical and horizontal position of a series of bores or providing a profile of an extruder barrel.
Jakarta - Indonesia
Phone : 021-29563045 ( hunting)
Hp : 08156141954
Pin BB : 284152F7
Tampilkan Lebih Banyak